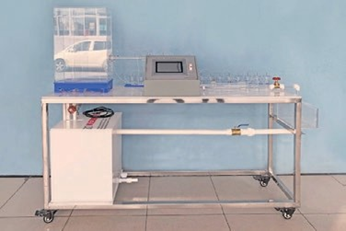
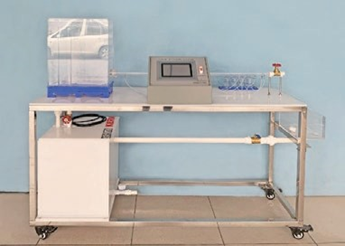
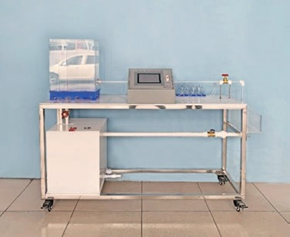
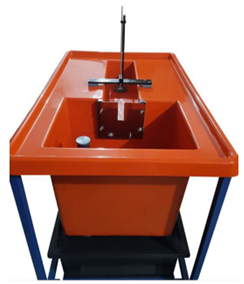
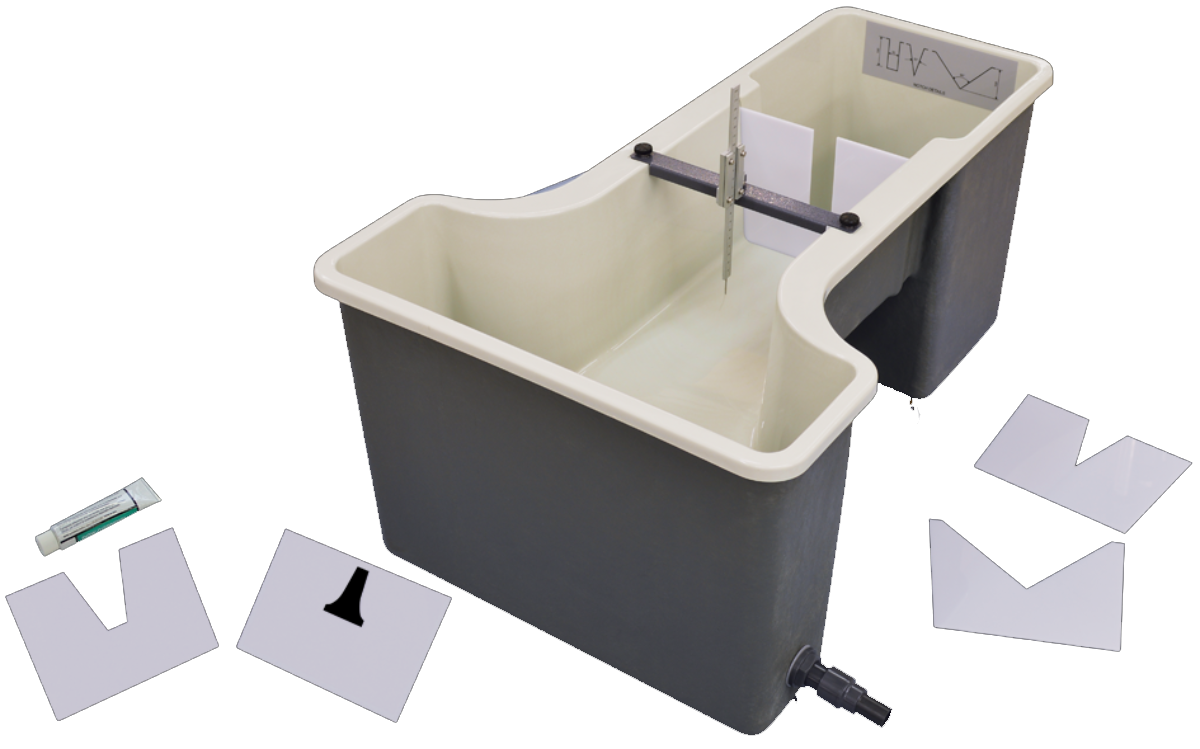
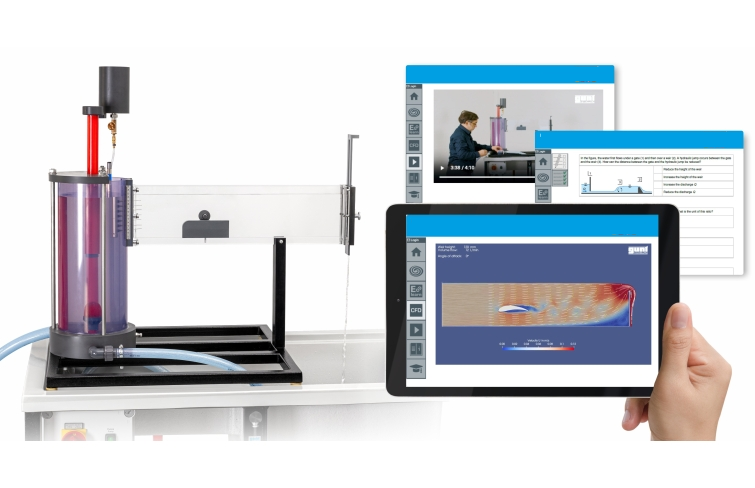
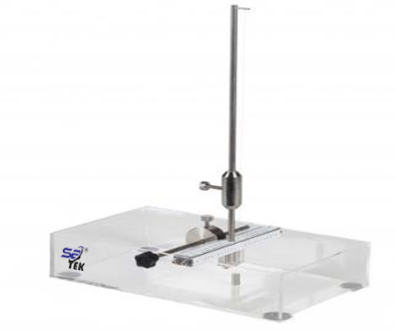
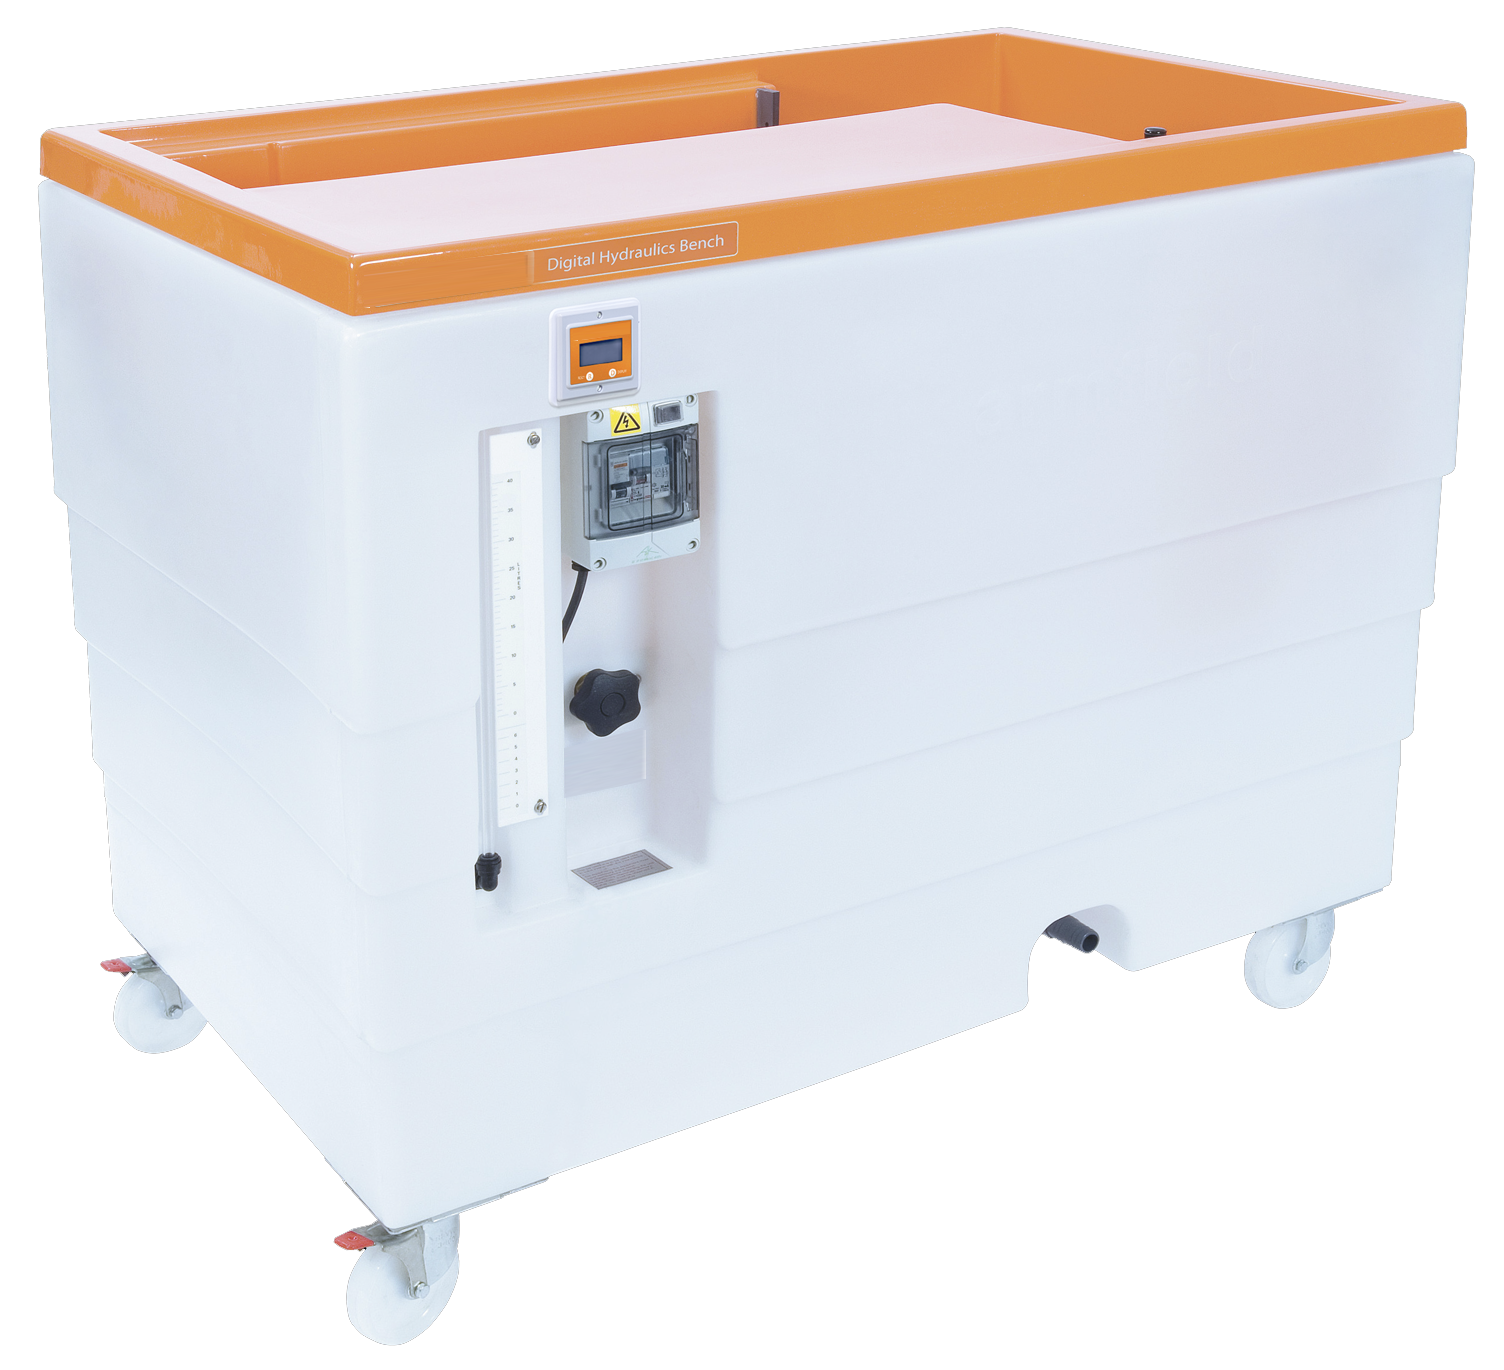
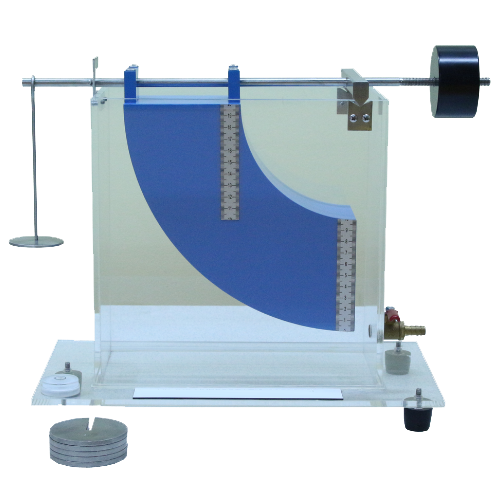
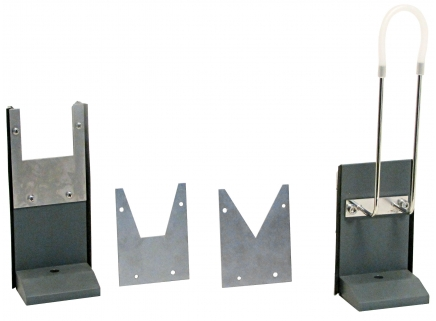
Features: A tank and set of notch weirs for the study of flow regulation and measurement devices. Portable, corrosion-resistant glass-?ber channel for ease of use and long life. Include one rectangular and two V-shaped notches for basic experiments. Minimum two additional weirs included for more advanced experiments. Adjustable depth gauge for precise measurement of water level. The apparatus demonstrates clearly the use of weirs as simple ?ow regulators. It works with and ?t on the top of the Digital Hydraulic Bench. The equipment a molded tank, the middle section of which form a channel. One end of the tank wide and the other end deeper than the rest of the tank. Each weir ?t in a sealed groove in the channel section. Water ?ow through the channel and over the weir, where the deep tank exit allows students to see the discharge. Measurement of the free water surface using an adjustable depth gauge attached to a beam across the channel. Made in accordance with the latest E
Technical Specifications:
Rectangular Notch Weir Depth: 100 mm.
Rectangular Notch Weir Width: 30 mm.
V Notch Weir:
One of depth 100 mm and 30° notch angle.
One of depth 100 mm and 90° notch angle.
Cipoletti Notch Weir: Depth 100 mm, width at top of notch 30 mm, width at base of notch 25 mm and thickness 3mm.
Linear Head/Flow Notch Weir: 3mm thickness and 88mm depth.
Channel dimension (minimum): 220mm x 180mm x 300mm.
Accessories:
Silicon grease, tubing, pipe clips and Printed operation manual.
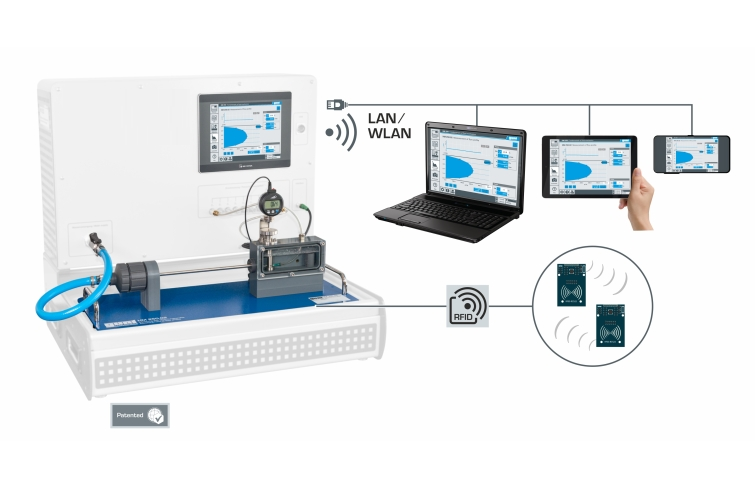
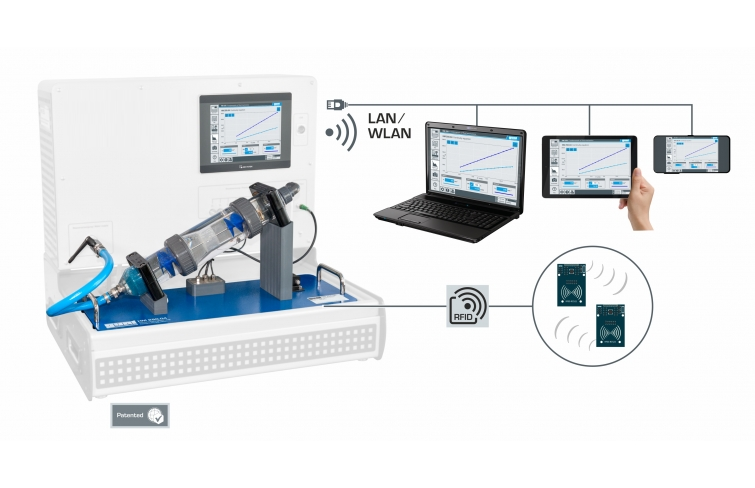
Include a Hydraulics Data Management System Software of following features as standard:
Simple software tool for manual data entry and recording of data for hydraulics experiments.
Intuitive and easy-to-use, with clear, customizable display and layout options.
Automatic calculation, charting and data export for efficient use of students and lecturer’s time.
Recording data manually.
Display of data in digital form or as an analogue meter.
Logging of data for printing and later analysis.
Export of data to Excel.
Perform calculations of recorded data.
Create charts with live updates as data is entered.